Silicon Valley Bank…What Just Happened?
Last week Silicon Valley Bank (SIVB) was closed by regulators and taken over by the FDIC. It is the largest bank failure since Washington Mutual in 2008. Over the next several days we are going to see references to the GFC (Global Financial Crisis) and contagion/systemic (potential of this to spread to others) in the press.
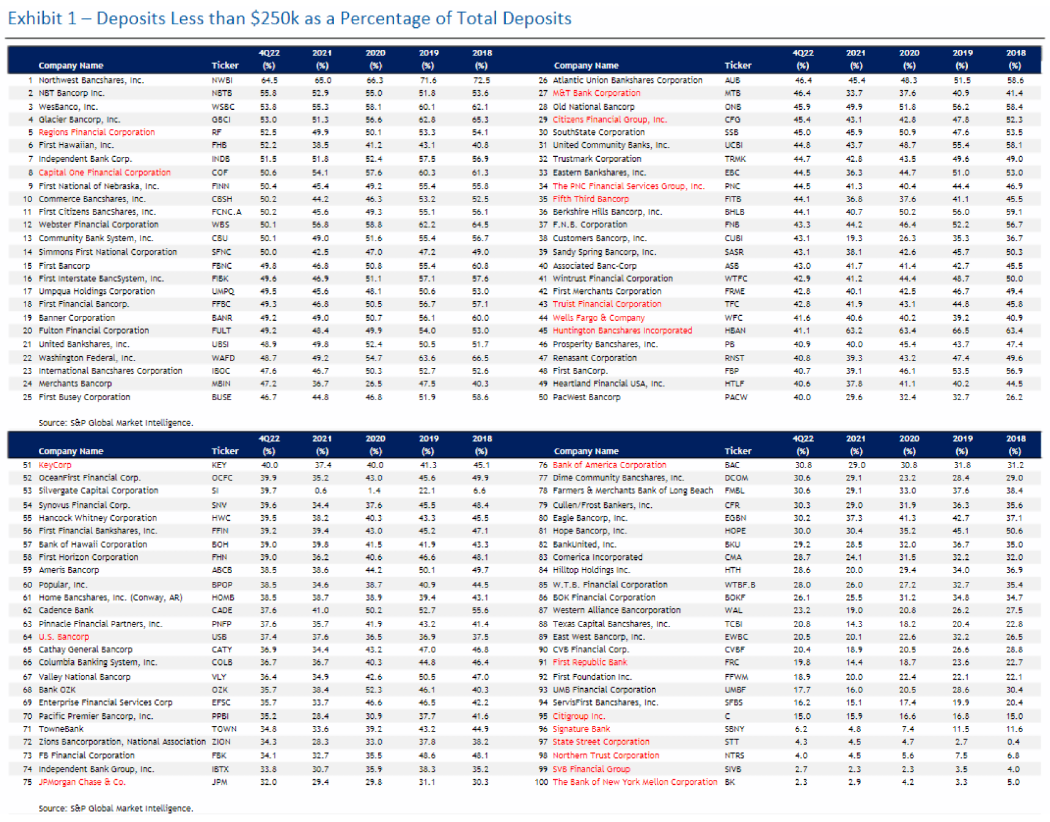
From a high level, Silicon Valley Bank had a disproportionately large amount of deposits during COVID, which was driven by the start-up boom, versus its peers given the nature of its business. During that time, they invested in longer term, low yielding securities as interest rates were low. The sharp increase in rates over the past year, reduced the value of those assets currently (note: if they were able to hold those assets to maturity, they would recoup their loss). Since a good majority (approximately 80%) of their clients are start-up companies (from the venture capital industry), most of their deposits were not FDIC insured (Exhibit 1). Over 97% of their deposits were >$250,000, and it has become more difficult for those companies to raise money given the higher interest rates and more challenging economy. The amount of withdrawals increased sharply over the past several quarters. The bank was forced to sell those assets at a loss in order to fund the withdrawals. The company then tried to raise capital to shore up its balance sheet, but instead caused withdrawals to further accelerate and exacerbate the issue, and thus the vicious cycle ended with them being taken over by the FDIC.
While the speed in which this occurred was a bit alarming, there are differences to what occurred in 2008. Where 2008 was an issue regarding credit losses, this is one more of margin (net interest income) for the banks. So, while there certainly could be issues with other banks, we do not think this will result in the contagion or systemic risk we saw in 2008, as the devil will be in the details with regards to the type of assets the bank has on its books and the type of deposit customer relationship it has.
In hindsight, the rate and magnitude of the Fed interest rates is the largest we have seen since 1980/1981. This almost unprecedented rise in rates will have some impact/shock to the system and experts have been trying to determine what that might be. This is one of the by-products of it. Will there be more? Quite possibly. However, as we get closer to the end of this rate increase cycle, the optimism for rate CUTS in the next 12-18 months will provide support and should keep the market in a trading range over the next several quarters which is consistent with our neutral view on equities overall.
Important Disclosures
The information contained herein reflects the opinion and projections of Bergamot Asset Management LP (“Bergamot”) as of the date of publication, which are subject to change without notice at any time subsequent to the date of issue. Bergamot does not represent that any opinion or projection will be realized. All information provided is for informational purposes only and should not be deemed as legal, tax, investment advice or a recommendation to purchase or sell any specific security. This shall not constitute an offer to sell or the solicitation of an offer to buy any interest in any fund managed by Bergamot or any of its affiliates. While the information presented herein is believed to be reliable, no representation or warranty is made concerning the accuracy of any data presented. Market conditions can vary widely over time and can result in a loss of portfolio value. Past performance does not guarantee future results.